Last month I replaced the apartment’s old thermostat with an Ecobee. Great device, connects to HomeKit, and it even warns me about poor air quality. Plus the old thermostat was decidedly not great, what with its baffling 1980s-era user interface.
But actually getting rid of the thermostat is the trickiest part of installation! It’s full of mercury, and it turns out that mercury disposal is a nuisance. You can’t just throw the stuff in the trash, and while you can drop it off at disposal sites coordinated by the Thermostat Recovery Program, there are only a few such places in Ottawa. And most of them are in light industrial parks that are nowhere close to where I live. So what to do? I could walk the 15 kilometre round trip, but light industry apparently runs on the same weekday-only banking hours my job does. Plus I don’t own a car, making a post-work drive impossible, not to mention a double tax on environmental consciousness. I’m not going to dump this in the garbage, so I guess I’ll eat the $35 rideshare cost one of these days. But now I’m curious: why are responsible mercury disposal sites situated so far away from where most people live?
Maybe I shouldn’t be too surprised. A cursory Wikipedia search reveals that mercury still has industrial applications, so it makes sense to set up your disposal point in close proximity to your biggest would-be polluters. So we have a right-tailed distribution that looks something like this:
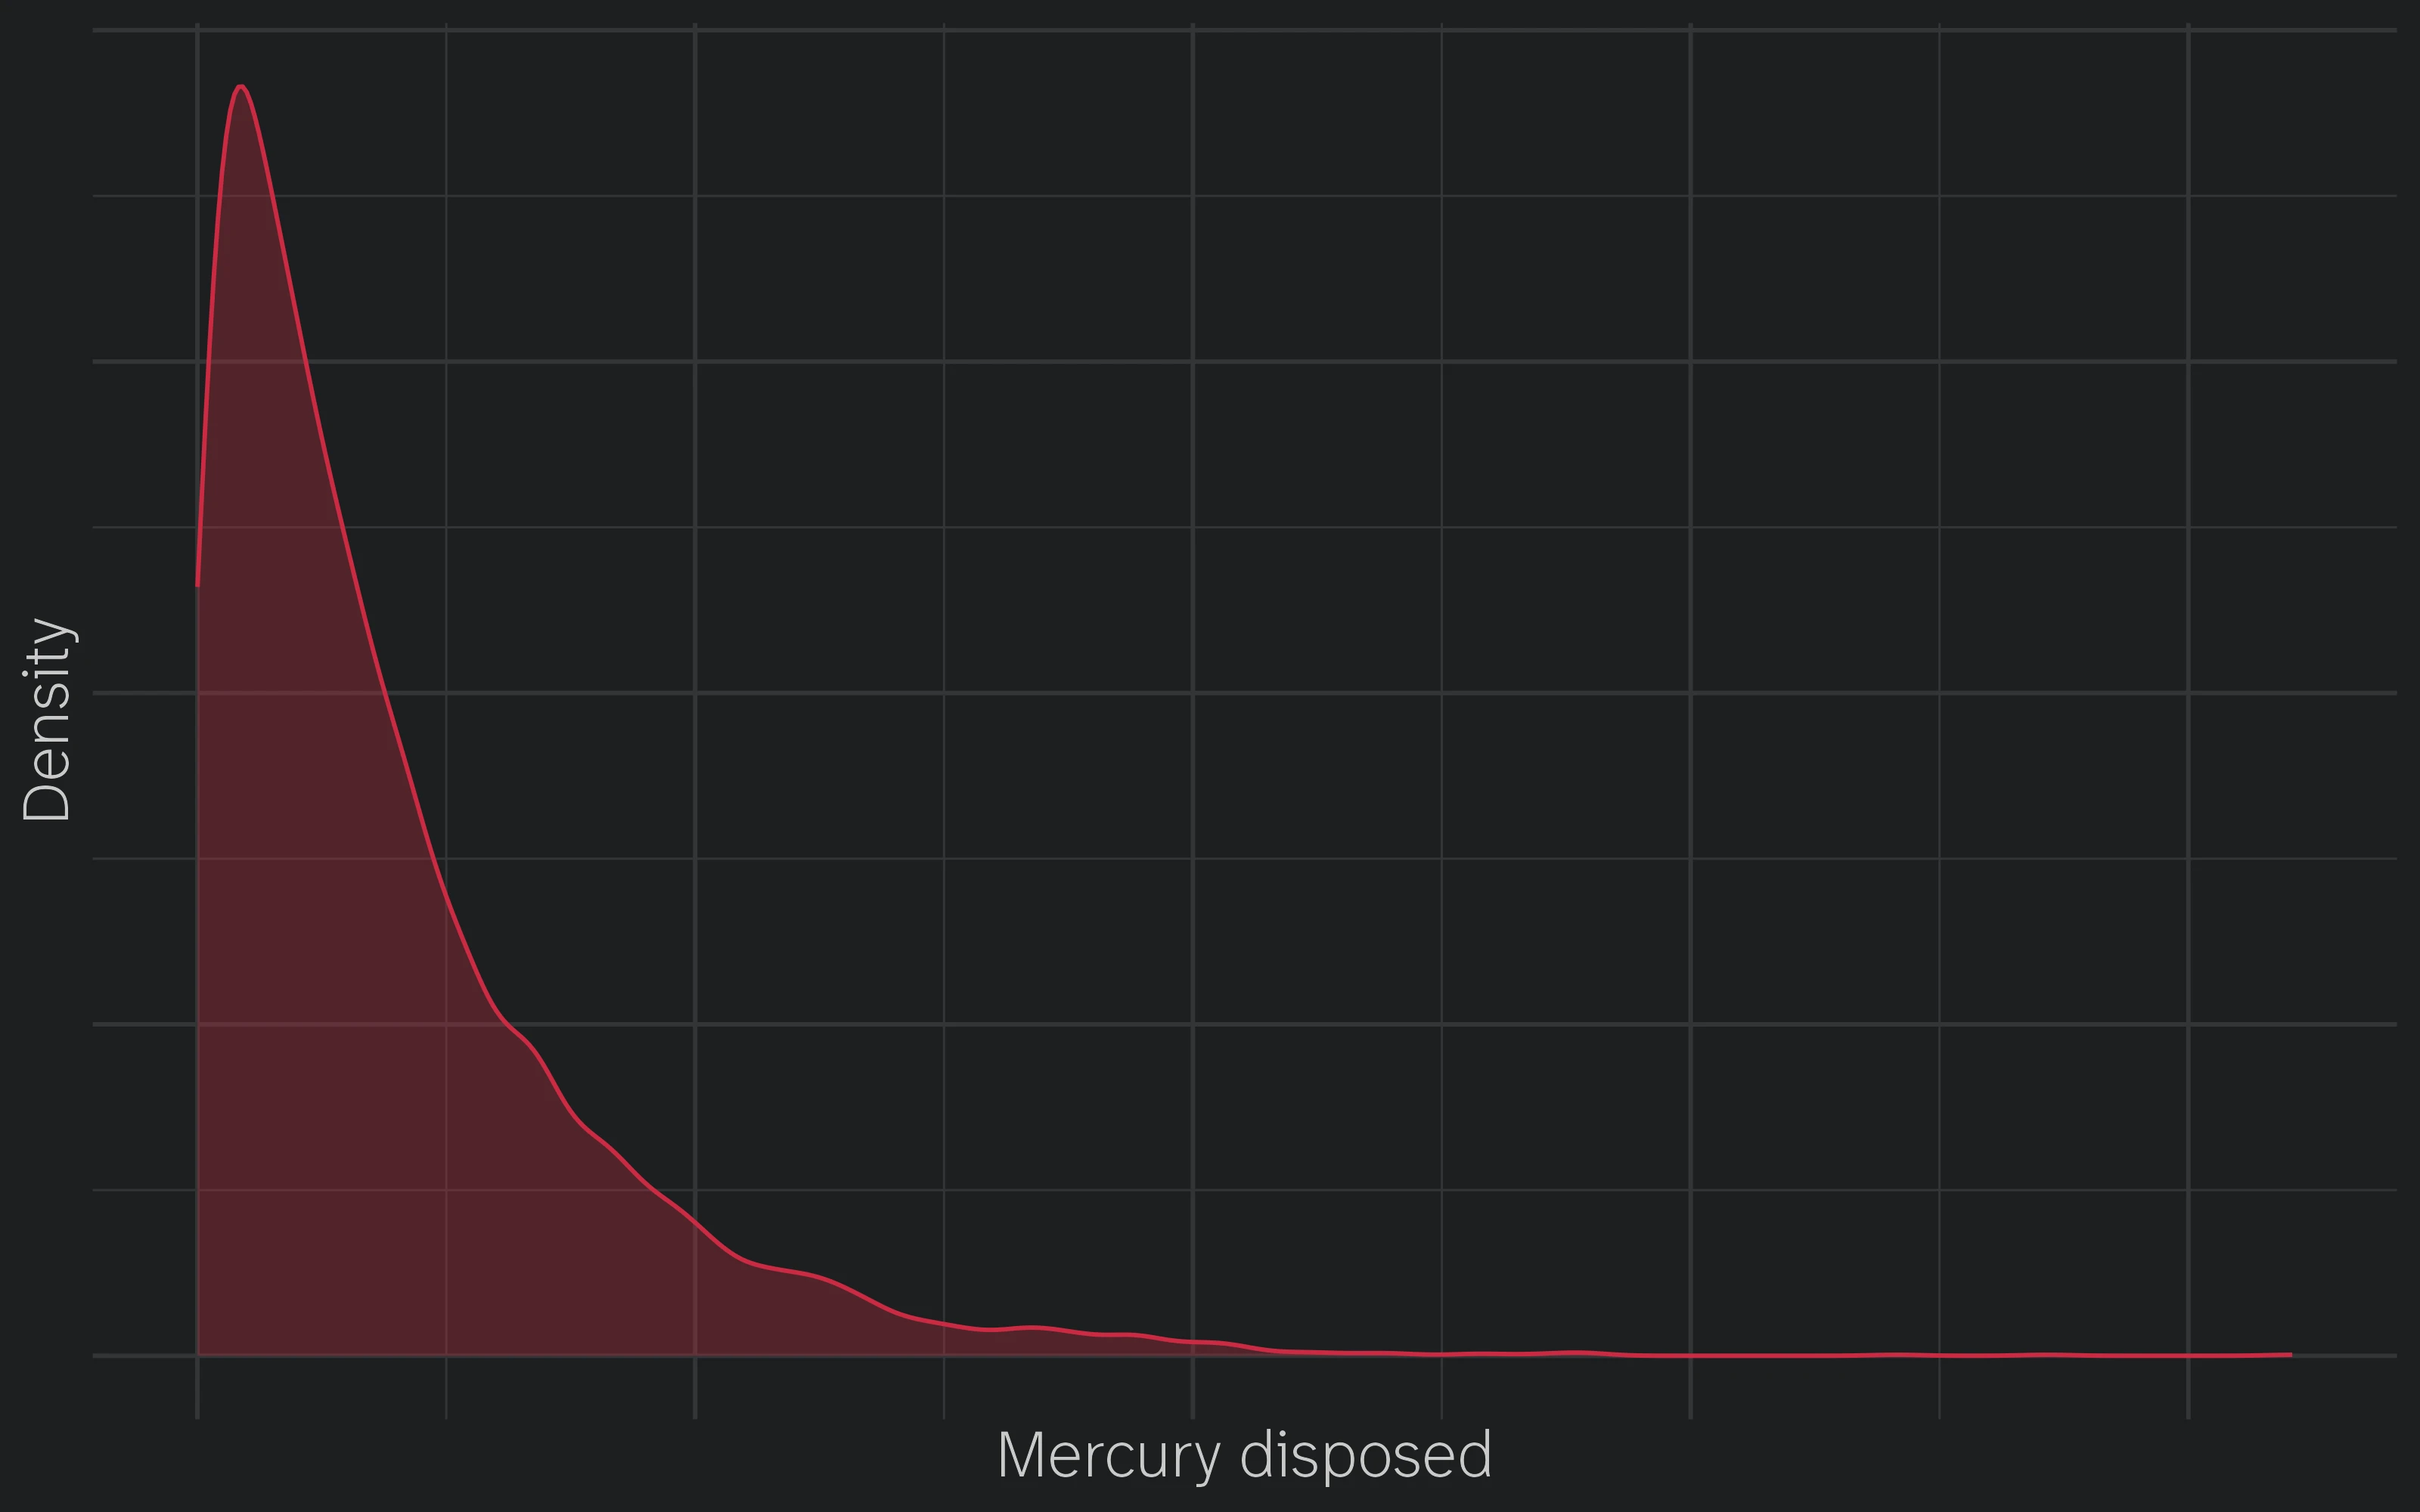
The tail here makes sense: while most people don’t dispose of much (if any) mercury, there are a few players who generate a tonne of it, and they’re probably the same firms that drive disposal placement. But I prefer to cast this as a case of mismatched medians:
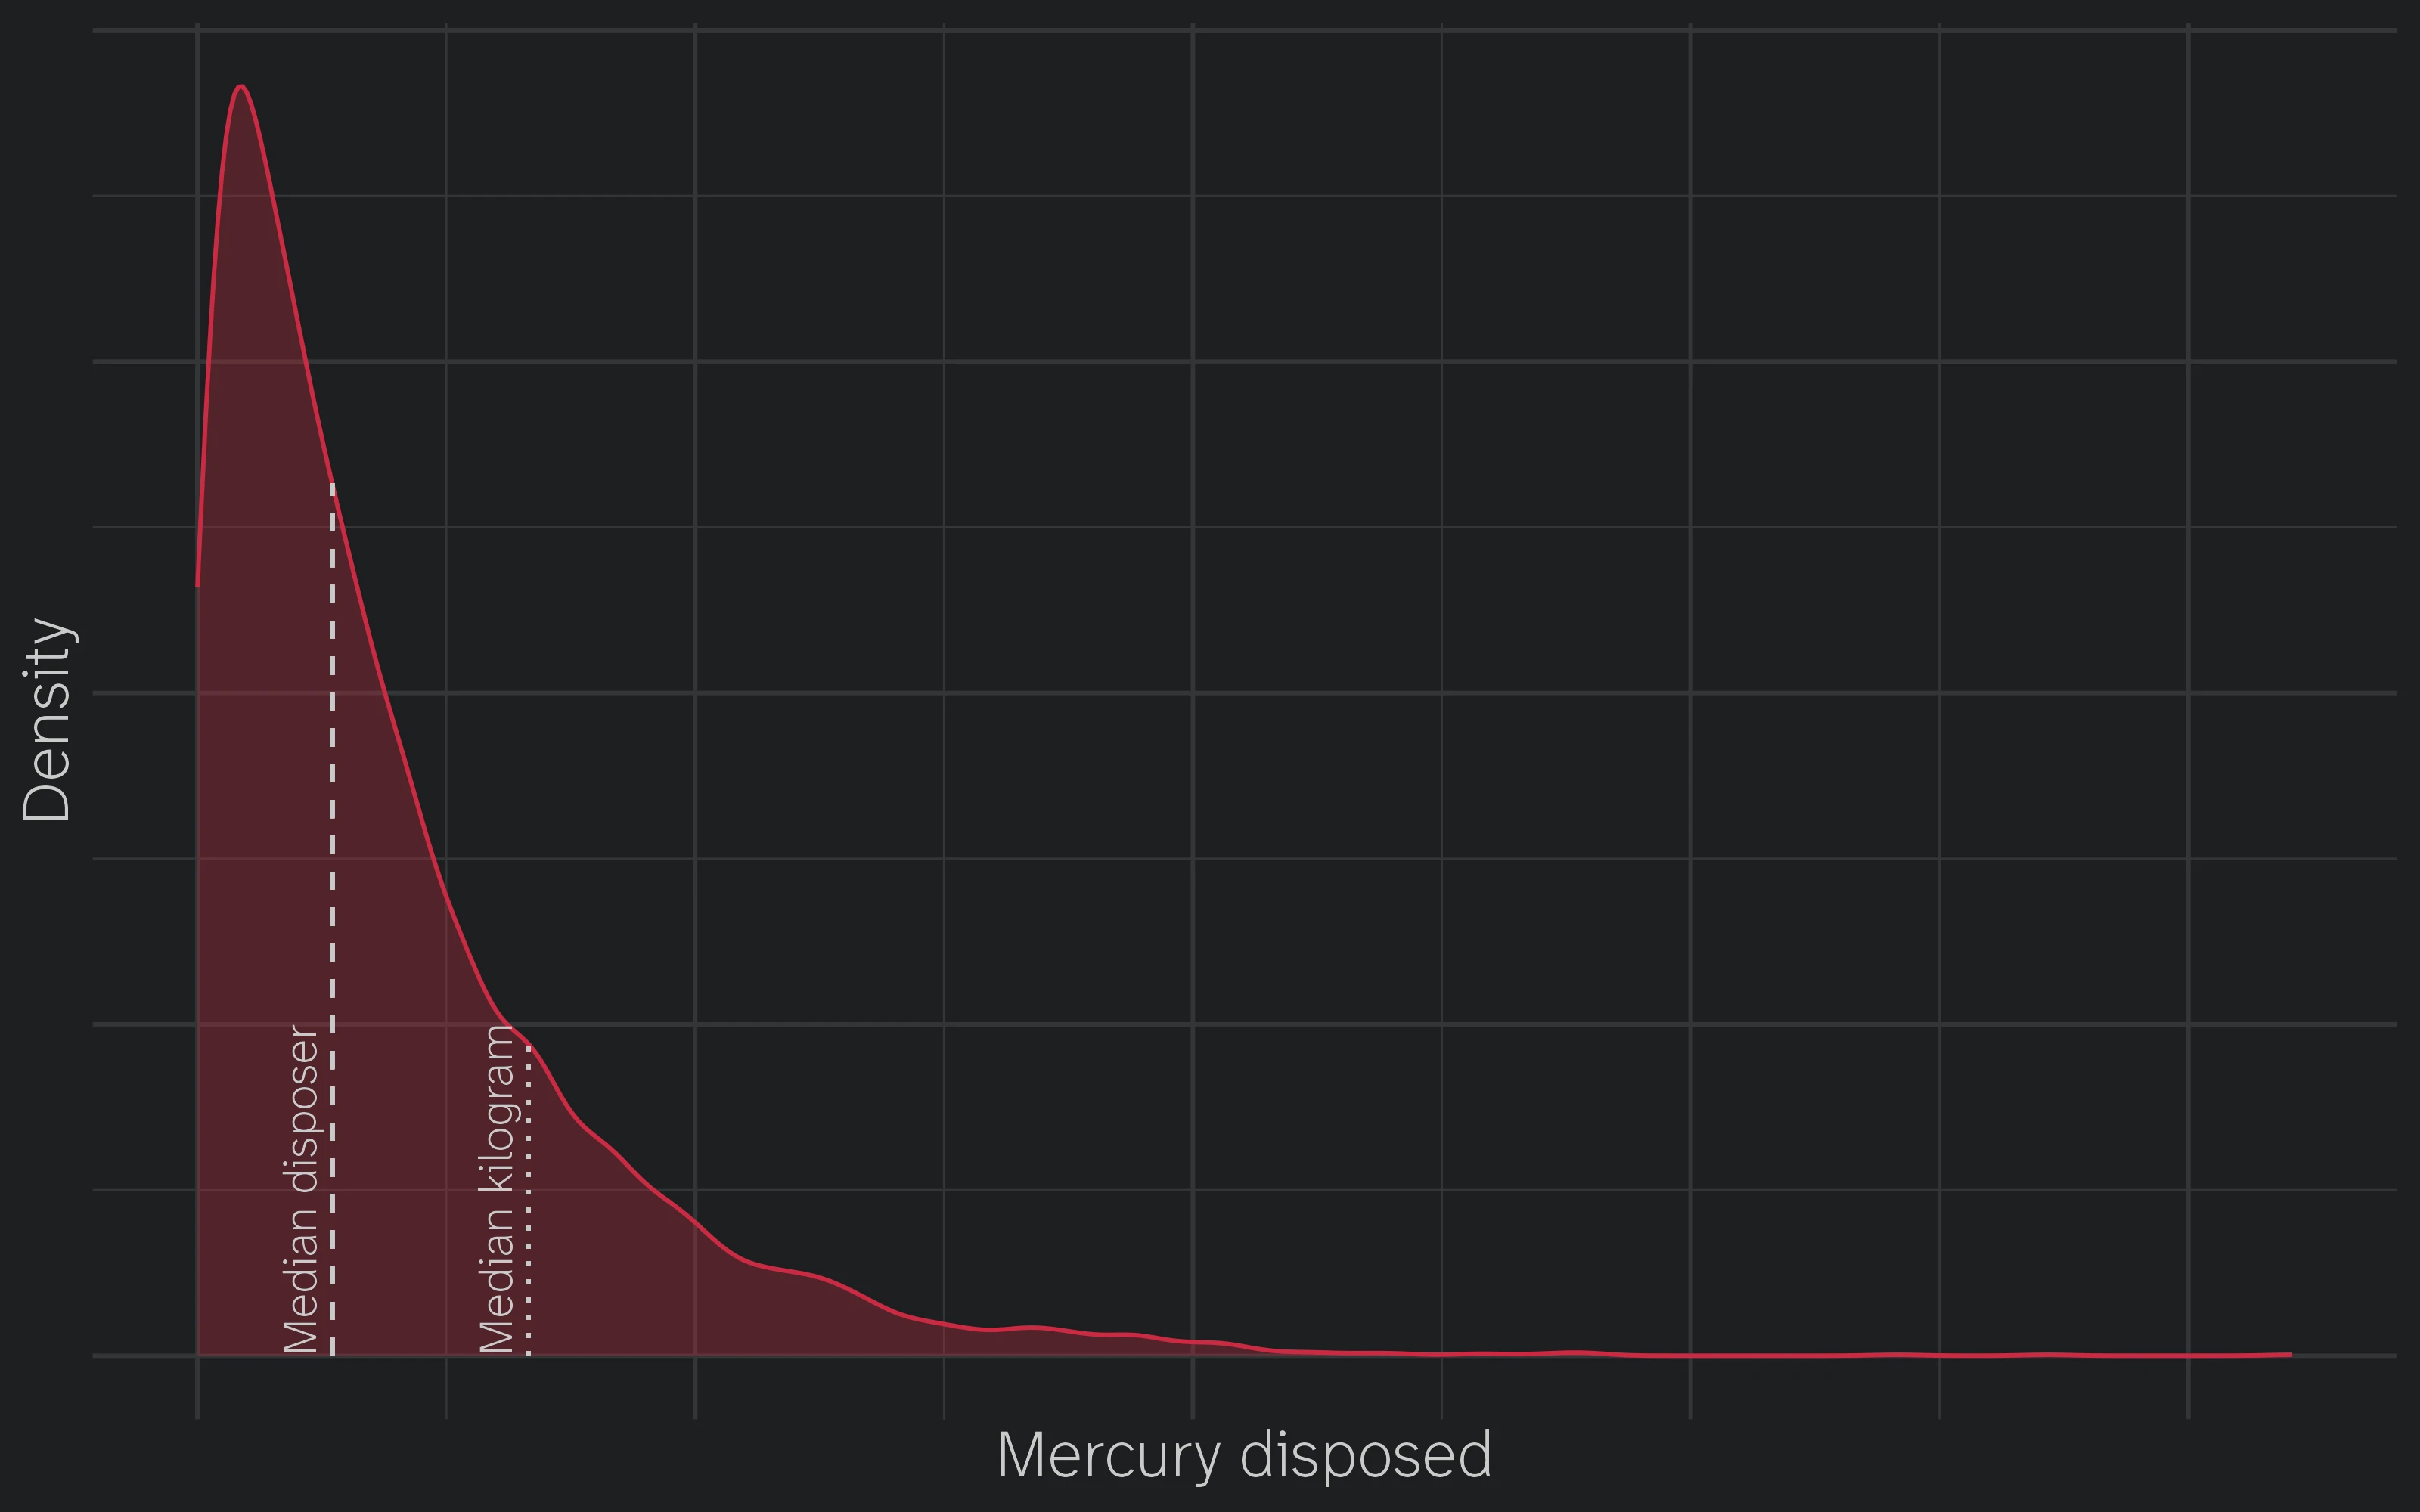
Now it’s clear that the median disposer isn’t responsible for the median kilogram of mercury.
This phenomenon has a real name, length bias, which is perfectly serviceable if you feel like cracking a stats textbook. But to me the median framing is more intuitive because it forces you to think about whose median you’re looking at, which makes the tails’ effect on the distribution more legible. And the solution isn’t fixed; sometimes the right strategy is focusing on the tails instead of the masses! Byrne Hobart does something similar on a podcast episode with Patrick McKenzie (opens in new tab) when he talks about the economics of paid services: the median spender of dollars usually doesn’t spend the median dollar. So optimizing for the person who actually spends that median dollar — which usually means caring about the tail behaviour — can make more financial sense than targeting your largest segment.
But we’re dealing with public choice here, not profit maximization, so which median makes more sense to index on? If you check the Thermostat Recovery Program (opens in new tab) website at the time of publication, the KPIs they report are:
- Number of mercury vessels: 359,774
- Number of thermostats: 237,187
- Weight of mercury in kg: 899.44
These metrics tell a clear story about volumes, but none about the number of distinct people who’ve used the service. This is because non-compliance is always unobservable. These metrics can’t suggest how different things would be if we’d counterfactually put the disposal sites downtown instead, so they’re biased by the same selection mechanism we’re trying to optimize.
What do we want to do then? Do we recover as much mercury from known entities as possible at the expense of the counterfactual, or do we incentivize proper disposal by the “average” (median) person, even if they’re not responsible for the median kilogram of mercury? Maximizing recovery sounds great, but it ignores another key way these parties are treated differently. If the tails are regulated, then the behaviours within those tails are effectively already constrained! A deeply non-exhaustive CanLII search indeed turns up some mercury regulation that’s aimed primarily at industry (see for example the Cross-border Movement of Hazardous Waste and Hazardous Recyclable Material Regulations, SOR/2021-25 (opens in new tab)). So we can argue that regulation turns disposal site placement into a compliance tool for the non-regulated parties, few of whom are being served by the current locations. This suggests more thermostat drop-offs in the central business district and suburbs.
Another argument for thinking in medians is that it reduces the temptation to oversimplify our population with a single bad point estimate. If we don’t quantify the tension between the median person and the person who’s responsible for the median unit of activity, the mean becomes an especially dangerous measure of central tendency. For example, “average-cost-per-x” metrics are insidious because they represent a person who doesn’t exist within either of the subpopulations we care about. The median OC Transpo rider probably takes a reasonably short trip, but the median kilometre is probably generated by someone commuting from Kanata or Orleans. A cost-per-rider metric fuses both medians into a principal component that doesn’t represent anything well, and probably results in routes that are too clunky for quick commuters — dodging a route over a couple blocks to capture a third-tier destination sounds like a nice coverage move, but it effectively degrades headway — but too infrequent for the long-haulers.
This is also breeding ground for ecological fallacy problems, where it’s perversely most policy-expedient to ignore your population’s dynamics entirely. In the mercury context, our cost per kilo recovered might look terrible if we set up a downtown disposal site, but that’s the price of capturing the low-mercury-volume people who were never driving to the industrial park in the first place. Why do some policy regimes do this? The illegibility of the subpopulations might be the entire point. Collapsing subpopulations with competing interests routes around some tough choices about who doesn’t get served. But as we’ve seen, the second-order effects — bus routes that annoy everyone, mercury drop-off sites that might not be used by a single Ottawa household — are strictly worse.
So in general, when your distribution is skewed, your medians won’t match. One of them represents the actors, and the other is weighted by what they’re doing. Specifying both helps avoid collapsing our subpopulations into bad point estimates, and it increases our policy optionality by showing us exactly who we’re serving, who we aren’t, and when that mix is worth changing.